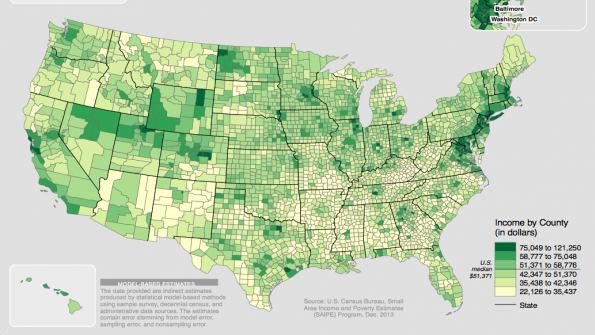
County wealth varies by region
At the county level, household income differs drastically depending on region.
According to data compiled by the U.S. Census Bureau, in 2012, county-level median household income ranged from $22,126 to $121,250. The median household income for the nation was $43,020.
Of the 75 counties with the highest levels of income, the bureau found more than half were located in the Northeast, Maryland or Virginia. 79 percent of counties with the lowest household income levels were located mainly in the south.
The 10 counties with the highest median household income levels in 2012 were:
- Falls Church City, Va., $121,250
- Loudoun County, Va., $118,934
- Los Alamos County, N.M. $112,115
- Howard County, Md. $108,234
- Fairfax County, Va., $106,690
- Hunterdon County, N.J., $103,301
- Arlington County, Va., $99,255
- Douglas County, Colo., $98,246
- Strafford County, Va., $95,927
- Somerset County, N.J, $95,547
(Note: The Washington Post reports due to a quirk in the way the Census qualifies towns, cities and counties, Falls Church, an independent city, was counted among counties)
The 10 counties with the lowest median household income levels in 2012 were:
- Wilcox County, Ala., $22,126
- Owsley County, Ky., 22,148
- Holmes County, Miss., $22,535
- Clay County, Ky., $22,834
- Humphreys County, Miss., $22,945
- Starr County, Texas, $23,358
- McCreary County, Ky., $23,810
- Madison Parish, La., $23,837
- Sumter County, Ala., $24,059
- Quitman County, Miss., $24,117
The Washington Post suggests that the most affluent counties enjoy high household incomes due to higher levels of education, leading to higher wages. The regions with the highest incomes have a disproportionally large share of two-income households in which both partners hold degrees and have high-paying positions.
The Census found that of the 3,142 counties in the U.S., 1108 counties (35.3 percent) had a statistically significant change to household income levels from 2007 to 2012. Of those counties 997, or about 90 percent, saw decreases. Clusters of counties with decreases were ubiquitous, existing in all regions and virtually all states. In the graphic below, purple represents regions where median household decreased, green where it increased and white where there was no statistically significant change.

(Graphic courtesy of The U.S. Census Bureau)
However, 111, or 10 percent, of counties with changes saw a significant increase to household income, according to Census data. North and South Dakota contained the highest proportion of counties with gains – 55 counties, or 50 percent, to be exact.
Gains in North and South Dakota could be credited with expansions in the petroleum industry, a trend that you can read about in the December issue of American City & County.
For more information, download the full report.
_____________
To get connected and stay up-to-date with similar content from American City & County:
Like us on Facebook
Follow us on Twitter
Watch us on Youtube


